The STEGIS plugin is responsible for performing geographical analyses, executing all GIS operations, and conducting 2D computations, while providing and analyzing results. During the development of this plugin, efforts have been made to code and include all the tools required by users so that they do not need to exit the software environment when conducting modeling and performing hydraulic, hydrological, and other analyses. Therefore, the plugin ensures that all necessary tools for working with raster, vector, and geographical files, as well as performing hydraulic, hydrological, and topographical computations and analyses, are readily available and user-friendly.
In designing the user interface of this section of the software, efforts have been made to categorize all tools based on their functionality and make them easily accessible to create a user-friendly environment. This ensures that working with the plugin is as simple and straightforward as possible. All data, maps, and files generated by this plugin can be saved either permanently or temporarily and can be easily retrieved.
The main interface of this plugin consists of eight distinct sections, including:
- Map
- Main Layers
- Time-Series Layers
- Map Tools
- Layer Tools
- Tiles
- Coordinate Reference System (CRS)
- Computation and Modeling Tools
On the main page of the plugin, a map is provided that can load and display various raster and vector file formats, including GeoTiff, Geopackage, VRT, sdat, shp, etc. In this plugin, layers can be added in two forms: main layers and time series layers.
Main Layers #
These layers are either vector or raster and are fixed and individual. On the left side of the plugin, a designated area is provided for adding main layers, offering the following functionalities:
- Changing the order and position of the layers
- Showing or hiding the layer
- Creating a new layer
- Focusing the map on the layer
- Displaying the information stored within the layer
- Symbolization and adjusting the display settings of the layer
Raster Layers #
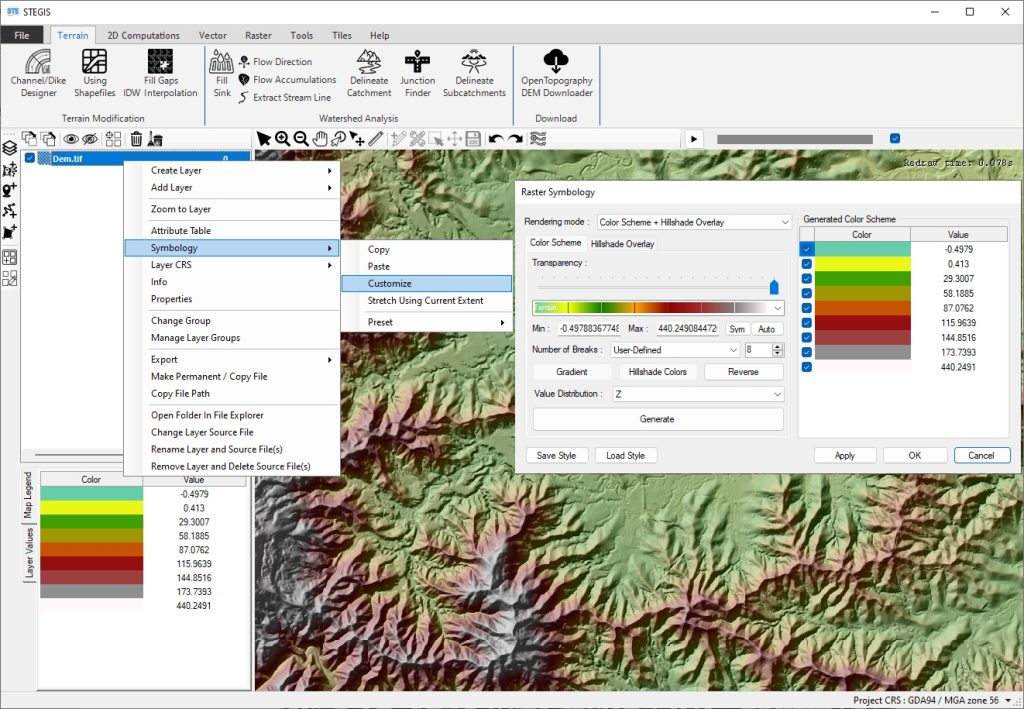
A comprehensive set of features has been implemented in the software for configuring the display of raster layers. These capabilities include adjusting various color spectrums or creating custom color spectrums, as well as saving, recalling, copying, and utilizing pre-generated values, among other features provided in this section.
One important feature to note in this section is the ability to calculate and generate a Hillshade map. This feature has been programmed into the software and enables better visualization and understanding of topographic maps.
Vector Layers #
For vector layers as well, just like raster layers, a comprehensive set of features has been provided. you can adjust the thickness, size, color, and other properties of the symbols used, which can all be customized and personalized.
Time Series Layers #
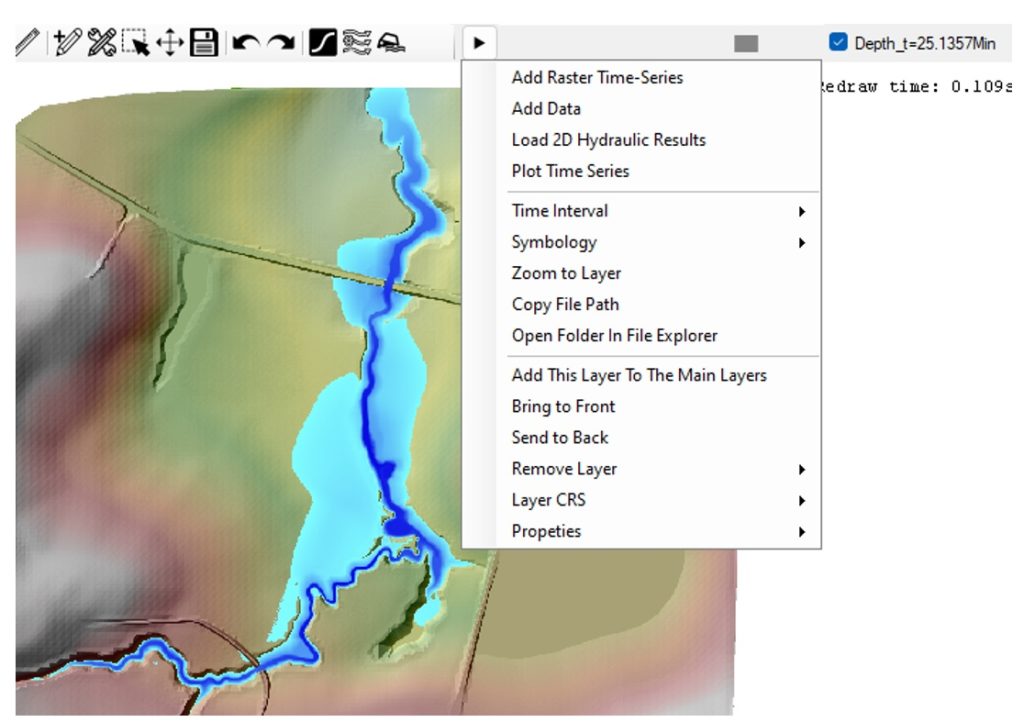
These layers consist of a group of raster files that are arranged chronologically. By displaying these layers consecutively, the changes in the parameters of the raster files can be animated. Since a large portion of the data used and produced by the software is time-dependent and organized as a time series, a dedicated module has been coded specifically for time series layers. These layers can be accessed via a slider located at the top right of the map; by adjusting the slider, the time changes and the corresponding file for that time is displayed. By right-clicking on the name of the currently displayed file, the following options become available for these types of layers:
- Loading raster files as a time series
- Retrieving modeling results produced by the software
- Plotting graphs of changes over time
- Animation and automatic playback
- Symbolization and adjusting the display of layers individually or collectively, static or dynamic (similar to main layers)
- File management, geographic coordinate system management, etc., similar to main layers

Map Tools #
A set of tools has been placed in the map toolbar and the Tools menu to control the map and utilize the software’s capabilities. These tools include:
- Tools for controlling the current zoom level and map position.
- Tools for viewing and identifying layer values by clicking and moving the mouse.
- A ruler tool for measuring distances in the field.
- Tools for drawing, editing, moving, selecting, and adding shapes to vector layers.
- Tools for undoing or redoing actions.
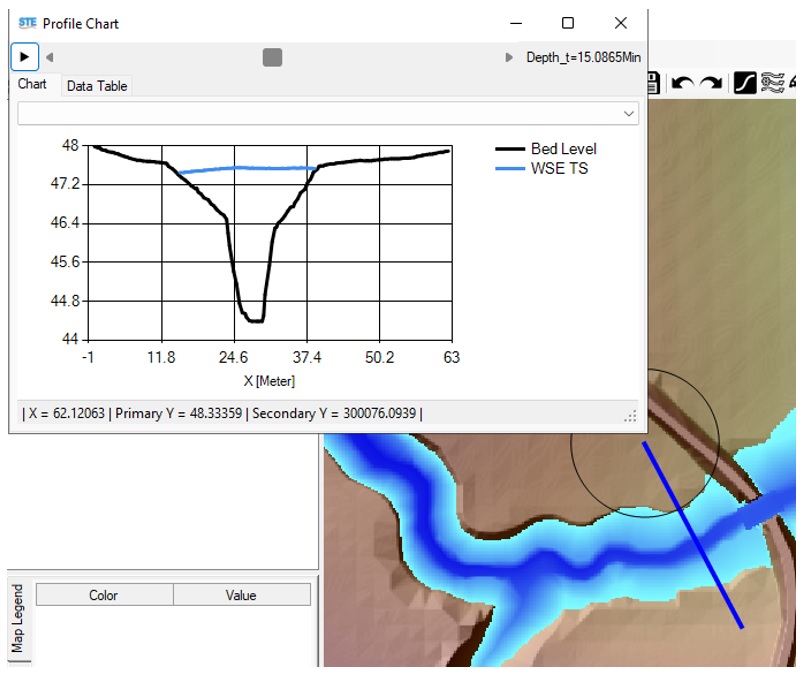
- A tool for plotting raster file values along a line.
Using this tool, by drawing a cross-section or a line along the river, it is possible to plot changes in water level or any other parameter against location. This tool is available for both main layers and time series layers.
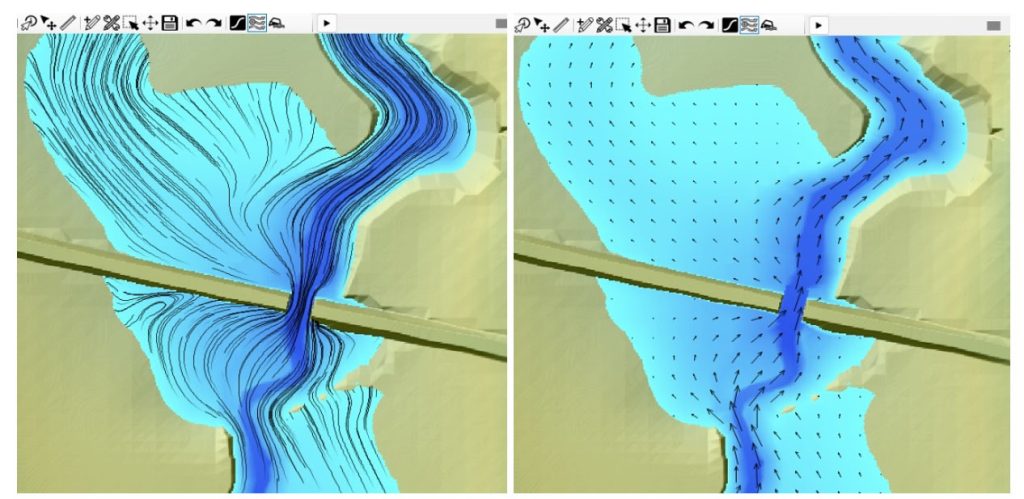
- Displaying the water flow direction
Since determining the water flow direction in the software can be computed and recorded using various methods, two methods have been coded for displaying the water flow direction as described below. It is worth noting that this tool is capable of directly displaying the water flow direction without any preliminary calculations, solely using either the water surface slope or the ground slope.- Fixed Arrows Method
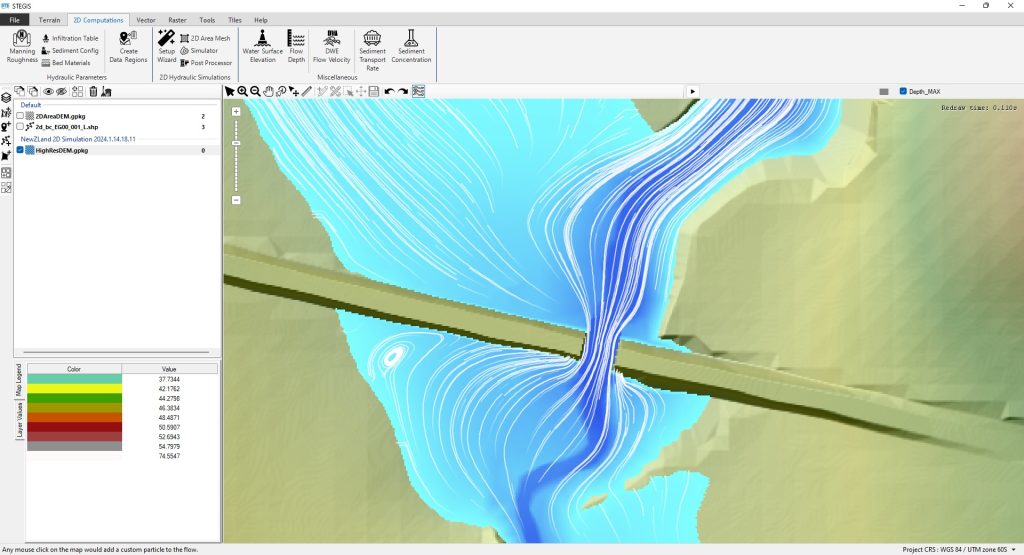
In this method, the water flow direction is displayed using fixed arrows. The size, thickness, contraction rate, and color of the arrows can be customized by the user. If a flow velocity map is available and selected, areas with higher flow velocities will be represented by larger arrows, while areas with lower flow velocities will be shown with smaller arrows. - Particle Tracking Method (Streamline Drawing)
By activating this mode, the software simulates particle motion on the water surface to dynamically and interactively draw streamlines on the map. Users can adjust the speed of the streamlines, the spacing between them, their thickness, lifespan, and color.
This method also allows users to add custom particles by clicking on the map, with the streamlines of these particles displayed in a distinct color. If a flow velocity map is selected, the speed of the streamlines corresponds to the flow velocity at each point. Therefore, in regions with higher flow velocity, streamlines move faster, while they slow down in areas with lower flow velocity.
- Fixed Arrows Method
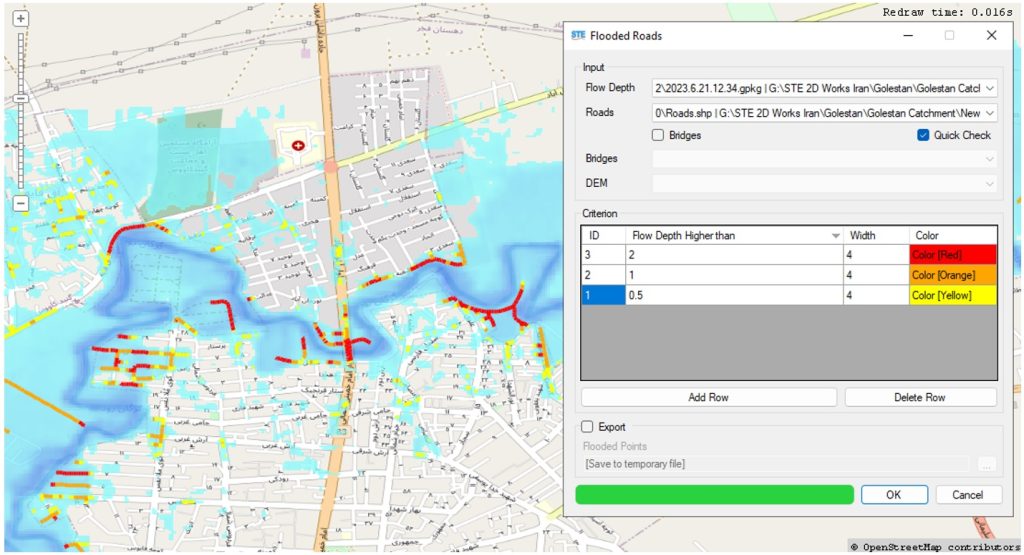
- Identification and visualization of flooding on roads and communication routes
Given the importance of identifying flood-affected and inundated points on roads and communication routes to protect lives and reduce damages, a tool for calculating and identifying these points has been coded and added to the software. By providing a flow depth map, roads, bridges, and configuring the symbols and color scales, the software is capable of identifying and visualizing flooding on roads and communication routes using this tool.
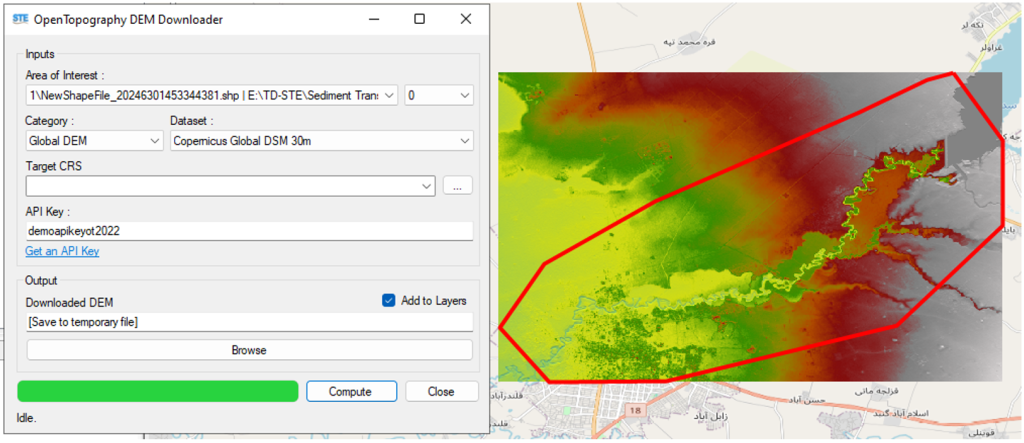
- DEM Downloader Tool
Recognizing that Digital Elevation Models (DEMs) are vital for hydraulic and hydrological modeling, a DEM Downloader Tool has been developed and integrated into the software. This tool enables users to select an Area of Interest (AOI) and automatically download high-resolution DEM data from online sources like OpenTopography. The downloaded DEM is instantly prepared for analysis and modeling, streamlining the workflow for terrain-based simulations.
- STE Channel/Dike Designer : Terrain modification
The Channel/Dike Designer in STE is a powerful tool for designing, modifying, and analyzing river channels, levees, and flood protection structures. This tool enables engineers and hydrologists to efficiently reshape riverbeds, construct artificial channels, and reinforce embankments to optimize water flow and flood protection.
Key features of the Channel/Dike Designer include:- Interactive channel and dike design with precise control over dimensions, slopes, and alignments.
- Terrain modification to integrate designed channels and levees into the DEM.
- Automatic cross-section generation for hydraulic modeling.
- Hydraulic analysis compatibility, ensuring seamless integration with STE’s simulation modules.
This tool allows users to assess the hydraulic impact of modifications and optimize designs to mitigate flood risks, improve river conveyance, and enhance sediment transport efficiency.

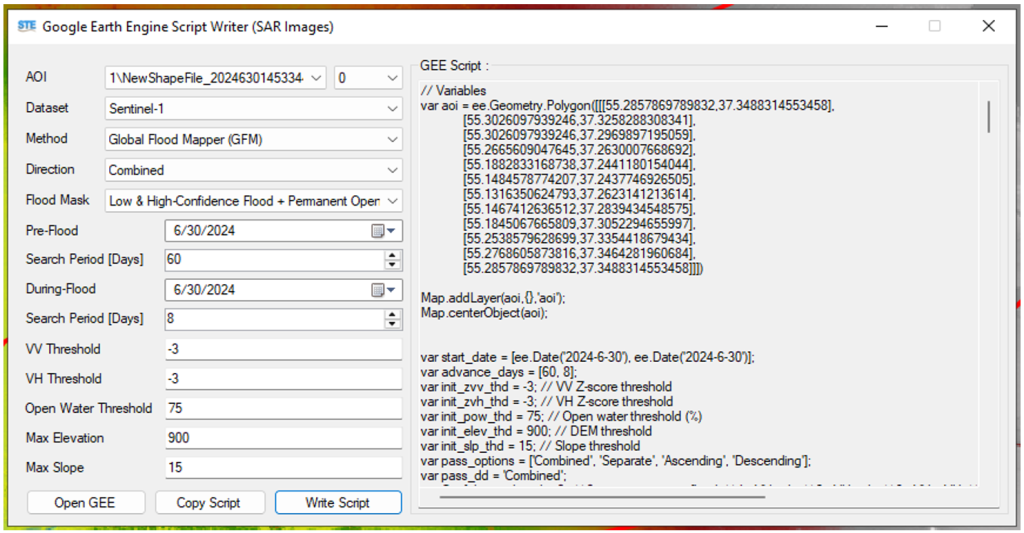
- JavaScript Code Auto-Generator for Google Earth Engine
To facilitate data retrieval from Google Earth Engine, a JavaScript Code Auto-Generator Tool has been developed and integrated into the software. This tool automatically prepares the required JavaScript code based on user-defined parameters such as time range and area of interest (AOI). This tool simplifies the process of gathering crucial geospatial data, reducing manual coding efforts and accelerating model preparation. The generated code can be directly used in Google Earth Engine to obtain the following data:- Land Cover Maps: For determining Manning’s roughness coefficients.
- Hydrological Soil Groups: Essential for infiltration modeling and calculating SCS Curve Numbers.
- Sentinel-1 and Sentinel-2 Maps: For identifying flood-affected areas and delineating flood extents using satellite imagery.
- Suspended Sediment Concentration (SSC) Maps: Calculating and estimating SSC based on Sentinel-2 imagery using remote sensing methods.
- Soil Texture and Composition Maps for Estimating Particle Size: To enhance sediment transport modeling, the software includes a tool for utilizing Soil Texture and Composition Maps. These maps provide information on the percentage of sand, silt, clay, and organic carbon, allowing the software to estimate sediment particle size distribution. The tool processes this data using built-in algorithms and generates particle size classes essential for sediment transport calculations. Users can load soil texture maps from various sources, and the software automatically calculates particle diameters, which can be integrated into bed material configurations for hydraulic and sediment modeling.
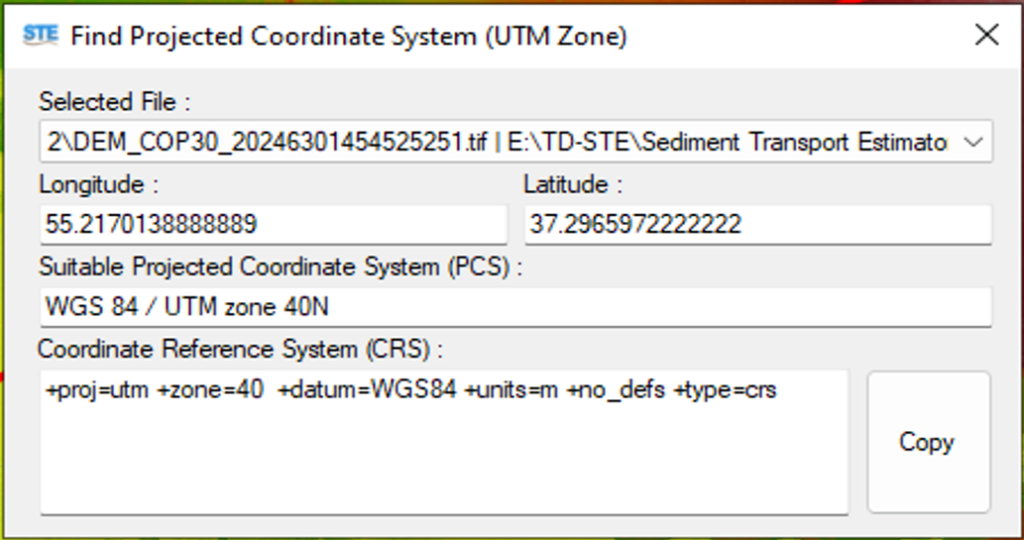
- UTM Zone Identifier Tool
To facilitate working with layers lacking projected geographic coordinates (UTM), the software includes a UTM Zone Identifier Tool. This tool is essential for converting geographic coordinates (latitude and longitude) to projected coordinates (UTM).
By receiving the central latitude and longitude of the layer, the tool identifies the corresponding UTM zone. It then provides the projected UTM coordinates needed for transforming the layer’s coordinate system. This feature ensures accurate spatial alignment for hydraulic and hydrological modeling.
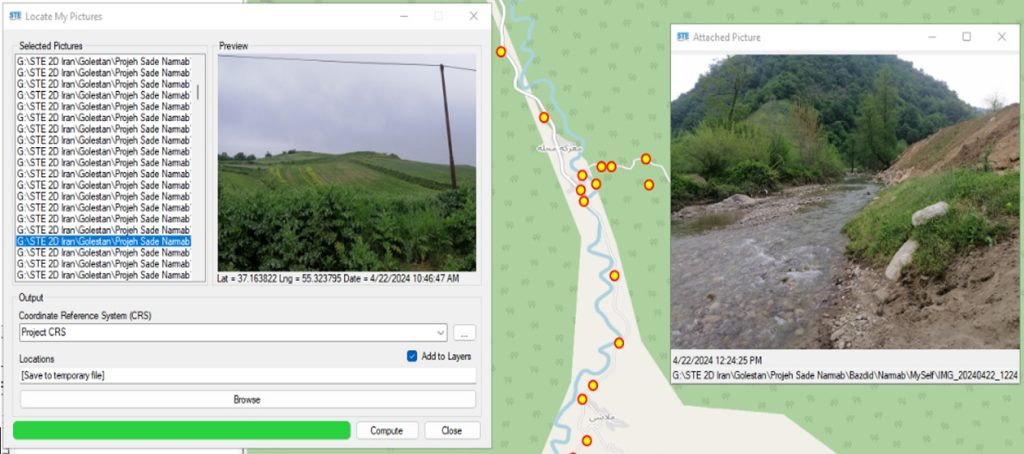
- Image Placement Tool
To compare the software’s modeling results with images captured by surveillance cameras or field inspections, an Image Placement Tool has been developed and integrated.
This tool allows users to attach images to the map and accurately place their capture locations on the map. Clicking on a marked image location displays the photo, along with its date, time, and other metadata. This feature helps validate model outputs by visually aligning real-world observations with simulation results.
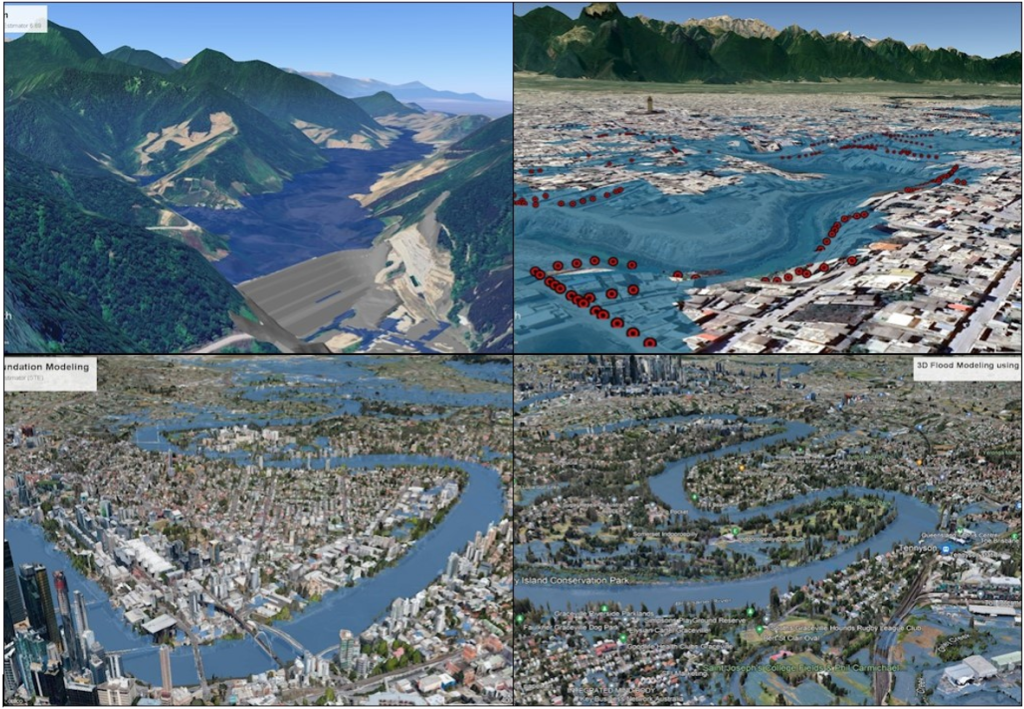
- STEGeo3D: 3D Terrain and Water Surface Visualization Tool
STEGeo3D is an advanced 3D visualization tool developed and integrated into STEGIS for analyzing digital elevation models (DEMs) and water surface elevation results in a three-dimensional environment. This tool enhances the understanding of topography, flood dynamics, and terrain modifications by providing an interactive and visually rich representation of elevation data.
STEGeo3D enables users to:
Render high-resolution DEMs in 3D for better terrain analysis.- Overlay water surface elevation and compare it against the terrain.
- Adjust terrain colors based on elevation for clearer visualization.
- Fly over the landscape using an intuitive camera movement system.
- Animate water flow to observe flood propagation over time.
- Utilize GPU-accelerated rendering for smooth performance with large datasets.
With these capabilities, STEGeo3D simplifies complex flood and terrain analyses, making it an essential tool for researchers, engineers, and decision-makers working with hydrologic and hydraulic models.
- 3D KML File Generator for Floodplain Visualization in Google Earth
To better analyze floodplains and inundated areas, the 3D visualization capabilities of Google Earth can be utilized. This requires converting raster maps of water surface elevation or water depth into 3D polygonal features with elevation values. The water surface elevation or depth is assigned as the Z-value in the generated file, allowing it to be displayed in Google Earth as a three-dimensional floodplain representation.
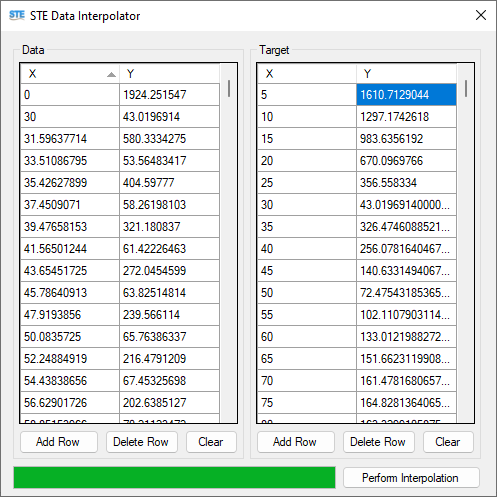
- STE Data Interpolation Tool
The STE Data Interpolation Tool allows users to perform linear interpolation on their data with ease. Users can input paired X and Y values in one section, defining known data points. In the other section, they can specify a set of X values for which the corresponding Y values will be calculated using a built-in linear interpolation module. This tool simplifies data processing and ensures accurate interpolation for hydraulic and sediment modeling applications.
Layer Tools #
To manage layers and perform the necessary operations during modeling, a comprehensive set of tools has been developed for raster and vector layers as follows:
Raster Tools #
- Merging Raster Maps with Surface Synchronization and Adjustment Capability
- Cropping and Trimming Raster Maps Using a Drawn Polygon Feature
- Raster Masking (Conditional Formatting for Raster Values)
- Filling and Completing Gaps in Raster Maps (Estimating Unknown Values Using Interpolation Methods)
- Applying Gaussian Blur to Reduce Noise in Raster Maps
- Reconstructing, Resizing Pixels, Clipping, and Reprojecting the Raster Maps
- Pixel Interpolation to Reduce Cell Size and Improve Accuracy
- Evaluating the Accuracy of Computed Maps Using Measured Data
Since evaluating the accuracy of the models used in the software is a crucial aspect of its development, a tool has been coded and added that can, by receiving raster maps of computed and measured values, calculate most of the existing evaluation metrics for assessing binary or continuous data. It also identifies the error of each cell by generating a raster map.

- Perform basic mathematical operations on the pixels of user-selected maps
- Clip raster maps using another raster map
- Convert raster maps into one or multiple polygon features (Polygonize)
- Adjust Origin
- Modify Nodata values in the map
- Convert raster formats
Vector Tools #
In summary, the coded tools for vector layers include:
- Manage recorded information (x, y, z, and m) for each point used in vector layer creation
- Extract and assign z-values from raster maps
- Merge vector layers
- Combine sublayers and shapes within a vector layer into a single unified layer
- Convert and transform coordinate systems
Tiles #
To obtain more information about the spatial location of layers and conduct a more detailed analysis, online maps such as OpenStreetMap, BingMaps, BingSatellite, BingHybrid, and others are required. Therefore, The necessary features for retrieving and displaying these maps online have been added to the software.

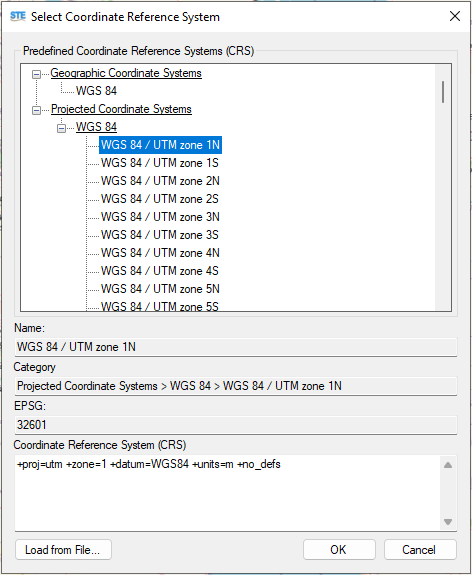
Coordinate Reference System (CRS) #
In the development of the software, efforts have been made to define and support commonly used and standard coordinate systems. Therefore, layers can be loaded and accurately positioned on the map regardless of their coordinate system. Coordinate systems are searchable and selectable. Additionally, the software now includes the capability to retrieve coordinate system information from various file types.
Computation and Modeling Tool #
This software is equipped with various equations, methods, and models for simulating surface water flow, sediment transport, erosion, and deposition. Therefore, in the development of STEGIS, all necessary tools have been carefully coded and integrated to ensure that users can conduct their hydraulic, hydrological, and other analyses without relying on external software. The goal is to allow users to perform and complete all computational processes entirely within STE. The development began with coding tools for watershed analysis, basin delineation, and hydrological calculations, extending to hydraulic computations and other essential analyses.
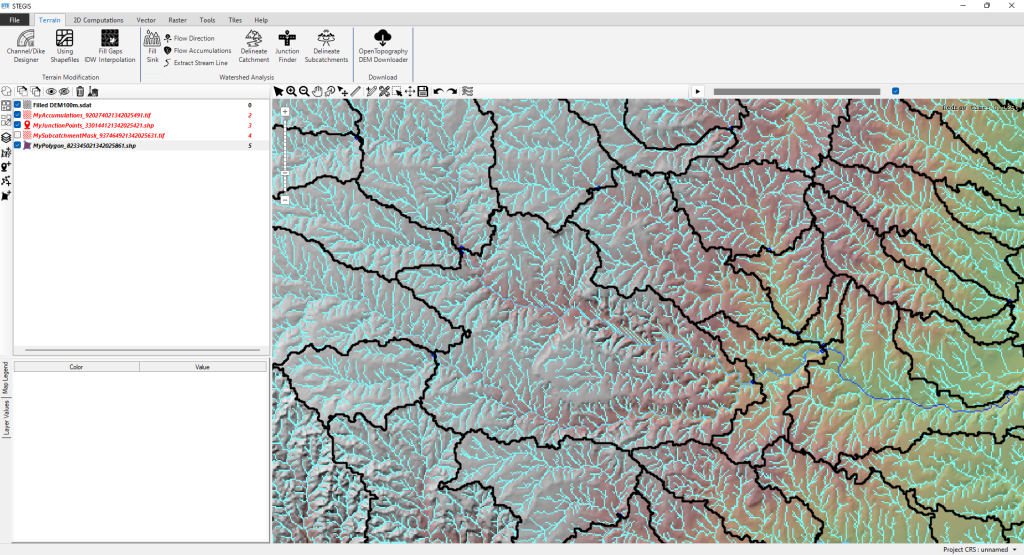
Watershed Analysis Tools #
One of the most important steps after obtaining topographic maps is to analyze the study area, watershed, and existing waterways. Examining slope, flow direction, and watershed boundaries helps minimize errors and improve modeling accuracy and efficiency. To support this, the software includes a set of specialized tools designed for comprehensive hydrological analysis, ensuring users can accurately assess and prepare their study area.
- Filling Sinks in a DEM
When a point in a topographic map has a slope where water flows into the central cell from all eight neighboring cells without an outlet, a sink is formed. In such cases, the water gets trapped, preventing proper flow direction. To resolve this issue, the slope within the sink and its adjacent cells must be adjusted to ensure smooth water movement.
Since surface slope is a critical parameter in topographic analysis, watershed delineation, and hydrological studies, it is essential to assess the slope between all cells in the DEM. If sinks are detected, they should be filled using various algorithms implemented in this tool to ensure accurate hydrological modeling. - Determining the flow direction based on the bed slope
- Calculating and mapping water accumulations or the stream network
- Extracting and pinpointing the stream path using a polyline
- Delineating watersheds and determining sub-catchment boundaries based on a user-selected outlet
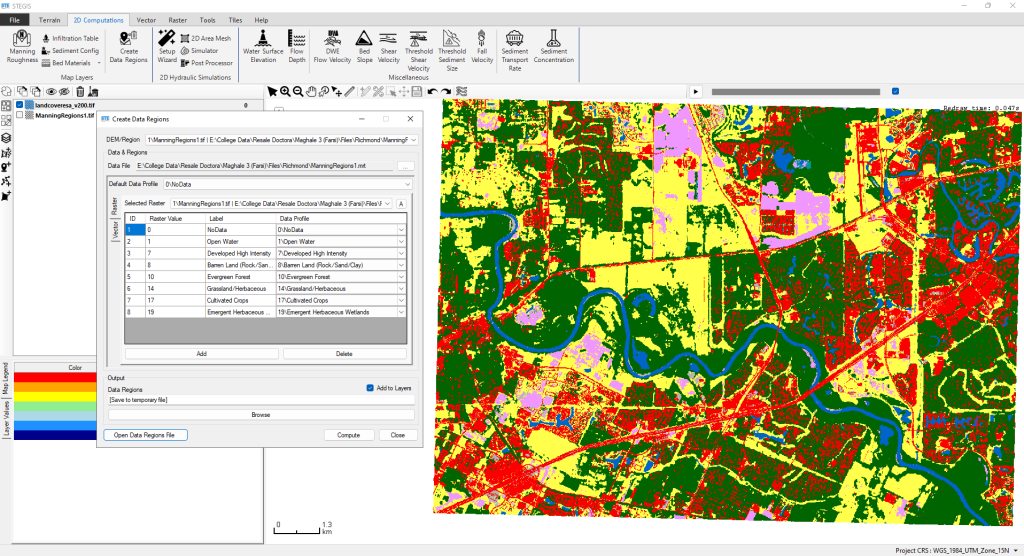
Map Layers and Computation Configs #
To perform two-dimensional computations, a set of Map Layers and Computation Configs must be prepared for the study area and incorporated into the computations. For each Map Layer, the process begins by categorizing the parameter values within the relevant tool. These categorized values are then spatially assigned to specific regions based on land cover maps, raster or vector layers, or any other spatial classification. Each category is represented by a corresponding raster map that defines the parameter values across the designated regions.
The required parameters that can be prepared using the coded tools in this software include the following:
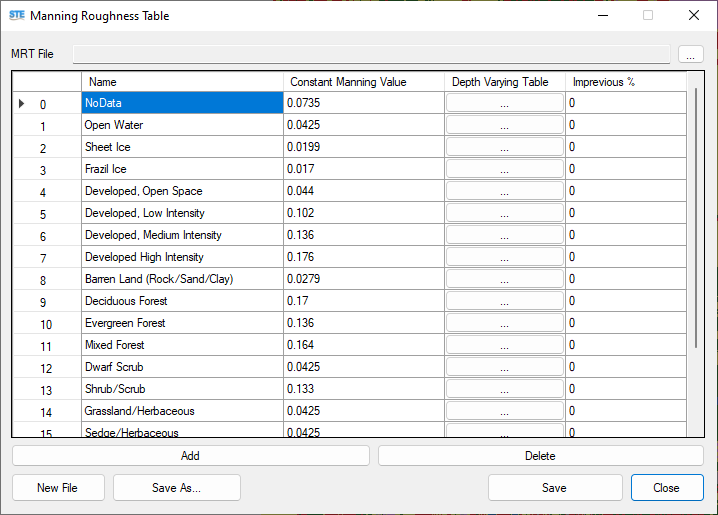
- Manning’s Roughness Coefficient
In this software, Manning’s roughness coefficient can be defined and prepared in two ways: as a constant value or as a depth-variable coefficient. This tool provides default roughness values based on global standards for different land cover types, which can be edited and managed by the user as needed.
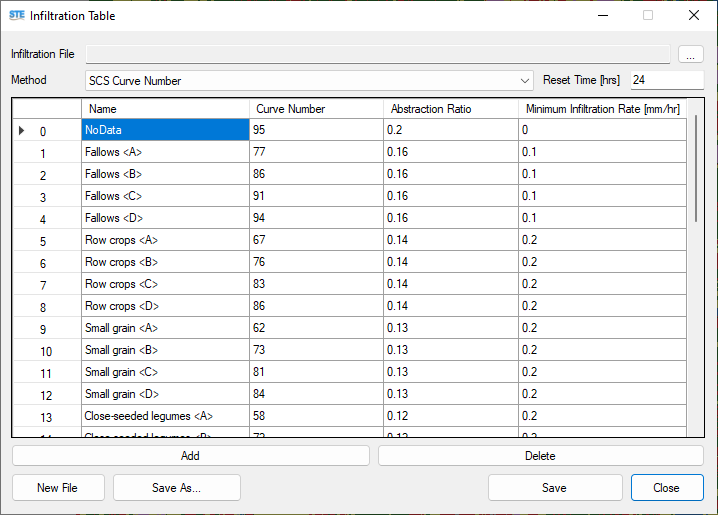
- Infiltration Table
Currently, the only method implemented in this software is the SCS Curve Number method, which is one of the most practical techniques for runoff estimation in watersheds. The key parameter in this method, the Curve Number (CN), is an empirical value used in hydrology to estimate direct runoff or infiltration excess resulting from precipitation. The software includes default CN classifications based on soil hydrologic groups and land cover types, following global standards. These classifications can be modified and managed by the user.
It is also important to note that the software provides a feature allowing the user to define a specific dry period with no rainfall, after which the infiltration values are reset, and the soil is considered dry again.